
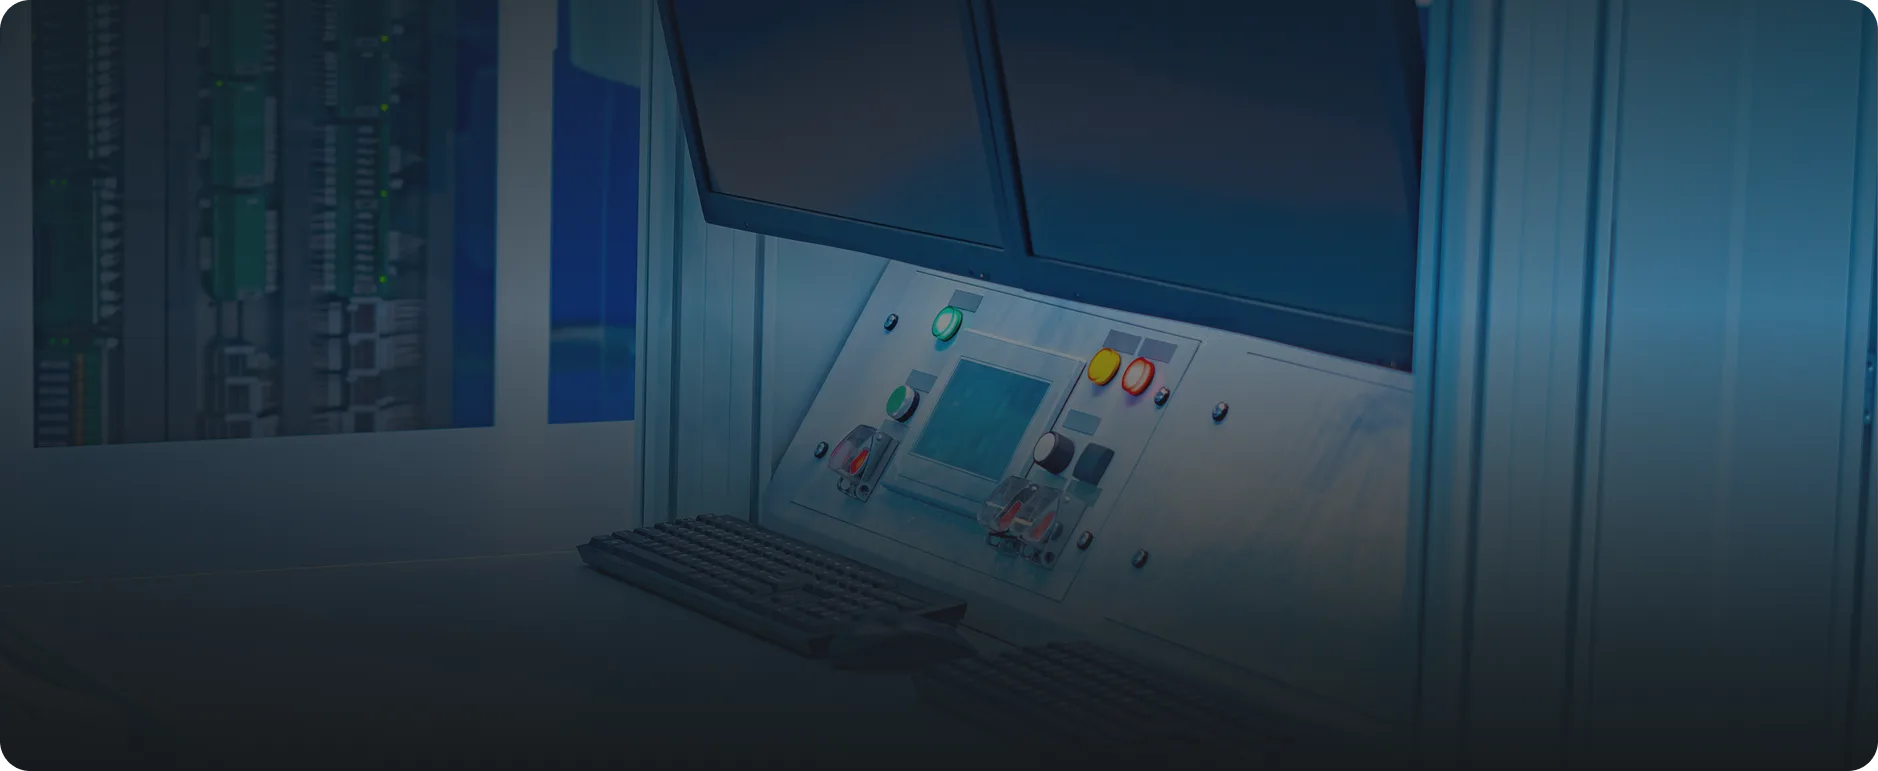
Support that watches the plant, not the phone
Most combustion plants operate blind between scheduled service visits. Support is reactive, waiting for failure rather than preventing it. The ThermoSys control system monitors the plant in real time and responds to what it detects: live data, exception alerts, and planned interventions, all delivered by the engineers who designed the system.
The lifecycle stage almost nobody in this market offers.
Design, build and commission are table stakes. The monitor and support stages are where a thermal asset earns its keep for twenty years, and they are built into every ThermoSys scope.
Remote monitoring
Combustion, steam and fuel parameters captured continuously over a secure connection.
Exception-based alerting
Trigger points on O₂, flue temperature, CO and cycling, raised on evidence of drift, before the trip.
Efficiency reporting
Fuel per unit of steam tracked over time, so drift is visible, explainable and correctable.
Planned maintenance
Service visits scheduled against operating data and combustion checks, not just the calendar.
Breakdown response and spares
When something does break, the response comes from engineers who already know the plant, with spares planned in advance.
Training and upgrades
Operator and technician training, plus system upgrades and re-tuning as fuels, loads and equipment change.
From plant signal to planned intervention, and back.
Connected support is a loop that never stops running. The plant reports, the data is watched, the evidence decides, and the work arrives planned.
Plant
Running · Instrumented
Secure Link
Encrypted · Managed
Data Centre
Logged · Trended
Watch
Engineers plus Triggers
Exception
Drift Flagged
Diagnosis
Cause Named
Planned Work
Scheduled · Prepared
Reported Result
Verified · Filed
Connectivity, trigger points and response terms are agreed per support plan
Four weeks, zero drama. That is the product.
Trigger points, response terms and reporting are configured per support plan.
The industrial automation page follows one shift. Here is the longer view. One month on a supported plant, and what connected support quietly prevents.
-
WEEK 1
Steady state
The plant runs, the record grows
Values logged and trended. Nothing exciting happens, which is exactly the point. The baseline gets stronger every day.
-
WEEK 2
Drift detected
Flue temperature creeping at constant load
The trend shows a slow rise. No alarm on the plant floor yet, but the pattern is already on an engineer's screen.
-
WEEK 2, DAY 11
Exception raised
Fireside fouling flagged, service raised as planned work
The trigger point is reached. The alert names the likely cause, and a visit is booked for a planned window instead of a breakdown at month-end.
Rising 4 days at constant load -
WEEK 3
Planned visit
The engineer arrives already briefed
Right spares, right tools, known cause. The intervention takes hours inside a planned window, not days inside a crisis.
-
WEEK 4
Verified and reported
Efficiency back on baseline, in writing
Post-work measurements confirm the recovery, and the monthly report shows the event, the action and the result.
The person who takes the call is the person who knows the plant.
No ticket queue, no script, no layer between the client and the engineer. That is a deliberate structure, not a small-company accident.
Explore Industrial AutomationSupport as the product, not the small print.
Uptime
Fewer surprises, shorter stoppages
Drift caught early and visits that arrive prepared protect production in a way no response-time promise can.
Evidence
Every intervention has a reason
Work is raised on measured evidence and closed with measured results, so the maintenance budget buys outcomes.